Flexible reports without spreadsheet work
Build the exact view your team needs
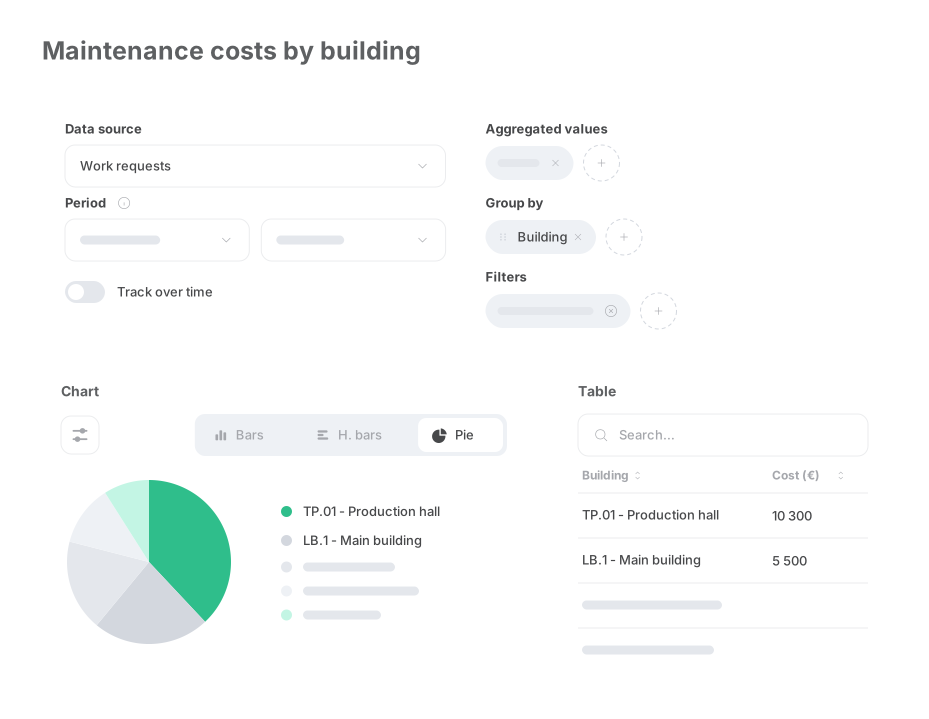
Create the exact report your team needs in minutes. Pick a data source, group by any attribute, define the aggregation, and OLIFY turns live operational data into a clear table and chart.
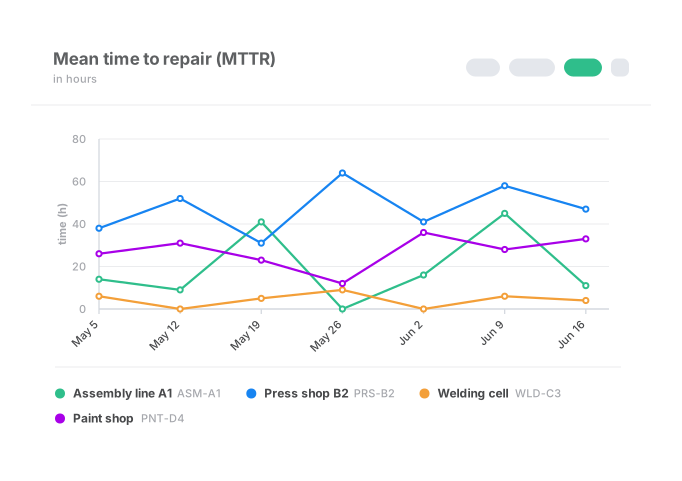
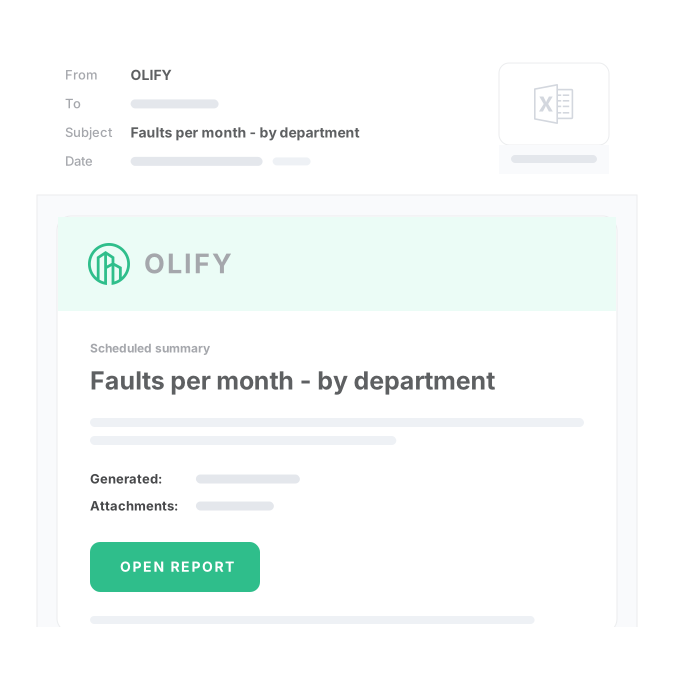
Every view can be named, saved, duplicated and adjusted. That means recurring management reports, technician KPIs and compliance overviews stay consistent without someone rebuilding them in Excel every month.