Energy management connected with operations

OLIFY connects energy management (EMS) with production, equipment and maintenance. Monitor energy consumption, benchmark costs across locations, and get notified when consumption deviates from expected levels.

  • Cost per unit of output — down to a space, machine or utility.
  • Distinguish real deviations from changes driven by production or operations.
  • Verify the effect of corrective actions on consumption, cost and emissions.
Costs by production

Cost per unit of output

OLIFY continuously calculates costs from measured consumption and your tariff, then links them to production volume. It also tracks energy performance indicators (EnPIs), such as kWh per tonne, unit, or another measure of output.

The consumption view mirrors the actual structure of your operations — from the main metering point through a production line to an individual machine. See where costs arise and how they feed into the cost of production.

Cost per unit of output
Forecast and deviations

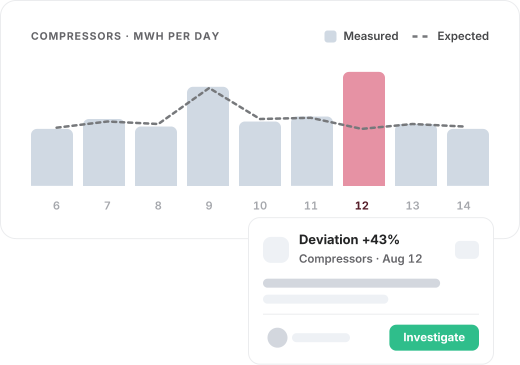
Real deviations in operational context

OLIFY forecasts consumption based on historical data and known operational factors, such as production plans, shutdowns or seasonality.

It continuously compares measured consumption with the forecast. This lets you distinguish changes explained by production or operations from a real deviation that requires attention.

Real deviations in operational context
Forecasts & targets

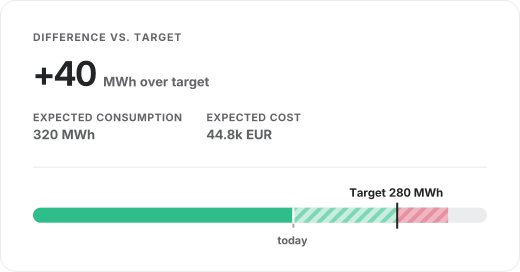
Track progress against consumption targets

Alongside actual values to date, you see the expected result for the full period.

The outlook shows how much energy you are likely to consume above target and what that excess will cost. This gives you time to respond before the target is exceeded.

Track progress against consumption targets
Verified outcome

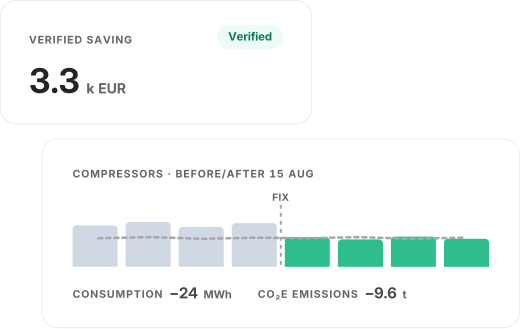
Verified impact of each action

After corrective action is taken, OLIFY verifies whether consumption returned to the expected level or whether the action delivered savings.

It quantifies the result in energy, costs and CO₂e emissions while accounting for changes in production and the effect of weather. You can support the impact of each action with measured data.

Verified impact of each action
Identify costly peaks

Identify costly peaks

The analysis connects consumption patterns with energy prices and 15-minute peaks. It shows when the most expensive peaks occur and provides a basis for adjusting the production plan.

Use the data you already have

Use the data you already have

OLIFY imports production data from your existing control system and connects it with energy data. No additional metering or manual data entry required.

Connect findings to corrective action

Connect findings to corrective action

Link each finding directly to a location or asset. Measured data and operational context remain available throughout investigation and corrective action.

Reporting based on traceable data

Reporting based on traceable data

OLIFY brings together consumption, energy mix and CO₂e emissions for a selected period. Each value retains its source and version.

Emission factors without manual updates

Emission factors without manual updates

OLIFY imports them from supported public sources and retains their origin and validity period. You do not need to repeatedly look up and re-enter emission factors.

Track all utilities together

Track all utilities together

Track electricity, gas, water, heat, cooling, compressed air and other utilities within the same operational structure. Each retains its own metering and costs.

Turn energy data into better operational decisions

Walk through a specific scenario with us, from ongoing cost management to verifying the actual impact of an action.